
How to prove content drives sales?
How to prove content drives sales?
A marketer at OMD Worldwide asked “How to tie specific content executions to sales and brand metrics?” It’s one of marketers’ Top 100 Questions on Content Marketing.
To prove content drives sales and brands, take 4 steps:
- Take a strategic approach to content marketing by building a foundation.
- Appoint a manager, one neck to grab, for analytics and conversion.
- Focus on analytics that drives marketing effectiveness and business results.
- If you’re starting out, do a pilot project in a defined market.
1. Take a strategic approach to content marketing
Content marketing is only as strong as the strategic foundation you build it on. Invite your internal clients and executives to co-create your foundation in a big tent event – so you can put more time into creating and promoting content, and less into reviewing content.

Building a solid foundation for content marketing takes 4 steps:
- Write a content mission statement: here’s how.
- Frame a content marketing strategy: here’s how.
- Agree on one clear, consistent message: here’s how.
- Know your audience: here’s how.
2. Find one neck to grab on analytics
In many companies, website marketers measure websites, email marketers measure emails, PR people measure PR, events managers measure events, and so forth.
Since each function in Marketing grades its own report card, measurement becomes disjointed, not cross-functional. Each metric reveals something, but you can’t put the whole picture together.
People who grade their own report cards often can’t resist the temptation to highlight positives and downplay negatives. Even worse, multiple functions may compete to claim credit for the same sales and revenues.
Grading your own report card is a problem that happens all the way up to the CMO level. CEOs rightfully complain that CMOs present an ever-changing array of metrics that highlight successes, instead of a consistent set of metrics tracked over time (as other departments do).
To overcome these problems, appoint one manager to be in charge of all marketing analytics and the conversion process. Why? Because you need one neck to grab.
Then, design a dashboard that makes it easy to present content marketing analytics consistently, month after month, quarter after quarter.
Avoid piecemeal measurements or snapshots of performance. Why?
Because what matters is not that web traffic spiked yesterday, but how the whole content marketing system is producing results to grow the business over time.
Make content marketing analytics and measurement boundaryless.
Collect and correlate all the metrics you need, gathering them wherever they’re tracked — in Marketing, Communications, Sales, Customer Service, or Finance.
You may find that multiple departments are taking credit for the same positive results. If 3 or 4 functions each claim to have generated the same $100,000 in additional profit, you face the problem called “attribution error.” It’s the #1 stumbling block for consumer marketers who work on content.
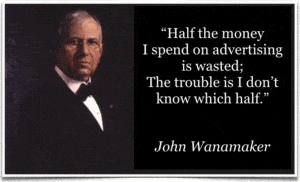
As marketing pioneer John Wanamaker said a century ago, “Half the money I spend on advertising is wasted. The trouble is I don’t know which half.”
Attribution error means, for example, knowing that $100,000 in additional profit was generated, without knowing exactly which marketing activities led to those sales.
Here’s a way to avoid the attribution errors that vex many marketers:
- Some companies attribute results to the “first touch,” the first proven touch point when a customer interacted with the company (such as email or a web page).
- Other companies attribute results to the “last touch,” the last touch a customer experienced before a purchase (such as a white paper download).
- The problem: neither the first touch nor the last touch tells the whole story. More than a dozen touchpoints may have led to any particular sale.
Attribution by its nature is always partial at best, since there’s no way to measure certain invisible touchpoints such as word of mouth, dark social media, and directly forwarded emails. As much as 84% of social media sharing happens in the dark on mobile devices, a RadiumOne study found.
Content Marketing analytics in one place.
That’s why you need to corral all your content marketing analytics in one place, to maximize visibility.
Direct the analytics manager to track metrics on fever charts, which show the various metrics’ interrelationships over time. Once you see how performance varies month to month, learn by asking, “Why?”
Once you have 24 months of history captured, you’ll be able to see how seasonality affects marketing analytics and outcomes.
3. Make marketing metrics meaningful to prove content drives sales?
To do so, focus on analytics that drives marketing effectiveness and track business success. Since Marketing and executives have different reasons for measuring performance, include different measures that are relevant and meaningful to each.
Executives want to know how Marketing drives growth:
- How many customers were gained?
- Did Marketing add sales and revenue?
- How many are in the sales pipeline?
- How many are qualified leads?
Executives may ask for a return on investment (ROI) calculation. To apply ROI to marketing sensibly, calculate a return on marketing investment (ROMI). Here’s how:
(Profit from revenue growth – Marketing expense)
Marketing expense
For example, say that successful marketing increases sales by $10 million and produces an additional profit of $1 million. Was that investment a good one for the company?
It depends on how much Marketing is spent to achieve the result:
- If the marketing expense was $2 million, the company got a negative ROMI of 50%. That is, each $1 invested in marketing produced 50 cents in additional profit.
- If marketing expense was $1 million, the company broke even. The ROMI is breaking even. (Note: companies that launch a new market or product may consider a break-even investment worthwhile.)
- If the marketing expense was $500,000, the ROMI is 100%. Marketing produced $2 of incremental profit for each $1 invested in marketing.
A comprehensive ROMI calculation includes direct expenses, plus a share of marketers’ compensation and benefits.
One problem with ROMI is that it can lead to a mechanical mindset: the higher the profit from sales growth, and the lower the marketing expense, the better. That mindset is dangerous because CFOs may conclude that marketing expenses should be zero, so they cut marketing expenses and strangle their brands – destroying brand value.
Inside Marketing, apply content marketing analytics to drive operations and improve performance over time.
Capture these key metrics:
- Website and SEO metrics such as search rank, keywords, website traffic, time on a webpage, bounce rate, and conversion path. See “Content Marketing Metrics: 10 Easy Ways to Measure Effectiveness,” a blog by Andy Crestodina.
- Email metrics such as subscribers, deliveries, open rates, and click-through rates. See “Email Analytics, The 6 Email Marketing Metrics and KPIs You Should Be Tracking,” a blog by Lindsay Kolowich.
- PR metrics such as share of desirable coverage, conversions, and cost-effectiveness. See “Katie Payne’s 5 Data Points You Need in Your PR Dashboard,” a blog by Steve Goldstein.
- Social media metrics such as followers, likes, shares, and user-generated content. See “7 Social Media Metrics that Really Matter – and How to Track Them,” a blog by Eddie Shleyner.
- Event metrics such as new leads, social media reach, new customers, and customers reached with product demonstrations. See “The 4 Most Important Metrics for Measuring Your Trade Show Marketing ROI,” a blog by Rachel Sprung.
- Brand value, as calculated under U.K. accounting rules. See “Brand Valuation – What It Means and Why it Matters,” a white paper from Brand Finance.
Build a dashboard to pull all relevant metrics together.
A dashboard helps you see patterns in the metrics you track. Now you can ask questions such as:
- Why do certain metrics trend up or down together, consistently?
- Do certain metrics move in tandem by coincidence, or does one drive the other?
- Which measures reflect consumer behaviors rather than outputs or attitudes? Behavioral measures often reveal the most.
Over time, your team will learn to develop hypotheses about why content marketing analytics is moving up or down. Once you have come up with multiple hypotheses to test, run A/B tests and experiments to find answers to questions like these:
- Do better headlines drive more clicks? Which words add the most power?
- Can evergreen content be boosted with newsjacking?
- Is there a clear, simple, logical path that starts with content and leads to purchase?
Start with a broad set of metrics, then narrow them down over time. A disciplined approach of consistent measurement over time reveals what works best to optimize your content marketing results.
Once your content marketing analytics system is in place to measure performance comprehensively, you gain the freedom to:
- Hypothesize about why results turned up or down.
- Conduct experiments to prove or disprove that hypothesis.
- Carry out A/B testing to identify lessons learned, which you can apply to all your content marketing.
All of which will help you demonstrate success again and again over time.
4. Do a pilot project in a ring-fenced market

If you’re struggling to show the value of your entire content marketing system, do a pilot project in a ring-fenced market or for a particular product. That enables you to measure and prove which content marketing approaches pay off best.
Where’s the right place to begin proving that content marketing works? Start by choosing one specific market to ring-fence, where the only kind of marketing will be content marketing – heading off any possibility of attribution error.
In summary, to prove content marketing drives sales, you need to:
- Take a strategic approach to content marketing: write down your mission, strategy, and message, and perform buyer persona research.
- Put a person in charge of content marketing analytics and conversion, then set up your all-in analytics measurement system.
- Focus on the analytics that drives marketing effectiveness and track business success.
- If you’re just starting out, do a pilot project in a defined market space.

“How to tie specific content executions to sales and brand metrics?” is one of marketers’ Top 100 Questions on content marketing. Here are the answers.
How to prove content drives sales.
Related Posts

News media interview? Read these tips to be a great spokesperson.
Great news! Your company scored a news media interview, a great chance to get your company’s story heard. And they’ve chosen you as the...

How to communicate a clear content strategy and message map to all marketing channels?
“How do you communicate a clear content strategy and message map to all marketing channels?” A marketer from Kohl’s asked this question in one...

5 Steps to Map Content Marketing to the Buyers’ Journey
To succeed, content marketing must make the buyers’ path clear. Buyers seek to answer specific questions during each step in the buying journey. And...

10 Marketing Ideas to Help You Leapfrog The Competition in 2023
Top 10 blogs focus on message maps, content marketing, and presentations Leapfrog the competition in marketing. We learn lots from readers like you —...