Top 100 Content Marketing Question: What are typical conversion rates of content marketing realistically?
Marketers jealously guard their results – including conversion rates of content marketing. That’s why it’s so hard to find information about typical conversion rates of content marketing.
Why don’t people share conversion rates? Because their competitors would love to know.
Conversion rates of content marketing vary dramatically, driven by these variables:
- Industry
- Company
- Product or service
- Customer list (subscribers)
- Timing
- Offer.
When measuring conversion rates of content marketing, here’s a blog on our measurement approach. It will help you continuously improve your own results over time – the key factor to increasing your conversion rates of content marketing.
That said, today’s guest blog by Jericho Gonzales provides industry benchmarks for email conversion rates. These cross-industry measures reflect conversion rates of content marketing across industries.
2019 email marketing benchmarks: by industry, day and metric
Analytics are critical to email marketing for any brand. By monitoring a wide range of metrics, you can determine how your email marketing strategies are performing.
However, there’s another way to evaluate performance. You can determine the success of your email sends by taking a look at current email marketing benchmarks.
Benchmarks based on analyzing 30 billion emails
Campaign Monitor recently released its email marketing benchmarks guide. It contains actual email data that you can use for your email marketing, no matter what brand you work on.
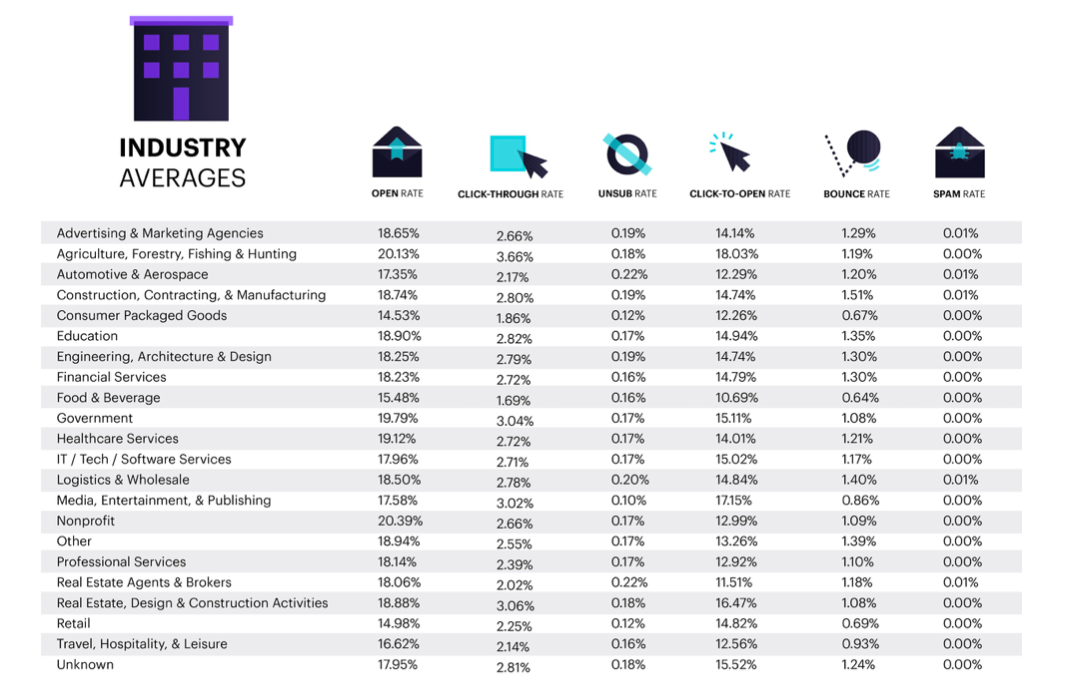
The company studied 30 billion emails from brands in more than 20 different industries, performing a thorough analysis. The result: the data in the Campaign Monitor benchmarks guide.
Here’s a quick snapshot of data from guide, by industry:
Benchmarks for all industries
- Average open rate: 17.92%
- Average click-to-open rate: 14.10%
- Average click-through rate: 2.69%
- Average unsubscribe rate: 0.17%
- Average bounce rate: 1.06%

Highest open rates (by industry)
- Nonprofit: 20.39%
- Agriculture, Forestry, Fishing, & Hunting: 20.13%
- Government: 19.79%
- Healthcare Services: 19.12%
- Other: 18.94%
Highest click-to-open rates (by industry)
- Agriculture, Forestry, Fishing, and Hunting: 18.03%
- Media, Entertainment, and Publishing: 17.15%
- Real Estate, Design, and Construction: 16.47%
- Unknown: 15.52%
- Government: 15.11%
Highest click-through rates (by industry)
- Agriculture, Forestry, Fishing, and Hunting: 3.66%
- Real Estate, Design, and Construction: 3.06%
- Government: 3.04%
- Media, Entertainment, and Publishing: 3.02%
- Education: 2.82%
Best days to send emails
- Day with the highest open rates – Thursday
- Day with the highest click-to-open rates – Saturday
- Day with the highest click-through rates – Tuesday
- Day with the lowest unsubscribe rates – Sunday or Monday
- Day with the lowest bounce rates – Monday

The day of the week impacts open and click-through rates, unsubscribes and bounce rates.
Christopher S. Penn uses artificial intelligence to detect which weeks of the year are the worst to send emails. Here’s a blog that includes his schedule of weeks to avoid emailing.
Worst days to send emails
- Day with the lowest email open rates – Sunday
- Day with the lowest click-to-open rates – Monday
- Day with the lowest click-through rates – Sunday
- Day with the highest unsubscribe rates – Wednesday
- Day with the highest bounce rates – Friday
How learning email marketing benchmarks can help you
Email benchmark data enables you to see how your emails stack up against industry standards. It helps you verify whether your emails are performing better or worse than those in your industry and others.
By comparing your own data with email marketing benchmarks, you’ll find out which areas need improvement.
Imagine you market a media and entertainment brand with a current click-to-open rate of 10%. Looking at the benchmarks, you learn that you need to work on your click-to-open rates, because the benchmark for that industry is 17.15%.
Enhance your email marketing
If your click-to-open rate needs improvement, what should you do? Here are some tips.
Lift your email open rate
This metric measures the percentage of recipients who opened a specific email. To increase email opens, start with your subject line. Consider making these changes:
- Personalization – Try including your subscriber’s first name in your subject line. It increases your email’s chances of being opened by 26%. According to data, personalized emails also have 6 times higher transaction rates than non-personalized emails.
- Testing – Test two variations of the same subject line, one short and one lengthy. Also, test two offers (such as discount vs. free shipping). Whichever variation gets the best response tells you which subject line to go with.
- Language – Include “power words” and language that attracts attention and encourages subscribers to open the email. Use words like exclusive, available, and expiring. Here’s more about how to use power words.
Increase your email click-through rate (CTR)
CTR is a metric that represents the number of subscribers who click on a link in your email, divided by the total number of emails sent. Ways to increase your CTR include:
- Segmentation – Rather than sending just one email to your entire list, create specific segments so that you can send targeted emails to each segment.
- Better calls-to-action (CTAs) – Avoid using generic copy in your CTAs like Buy Now. Instead, use benefit-focused copy such as Get These Comfortable Jeans Today.
- Optimized subject lines – Write subject lines that correctly capture the gist of your email.
Raise your email click-to-open rate
Your click-to-open rate shows the percentage of people who opened your email and also clicked on a link in it. Your click-to-open rate is important to track because it indicates the success of an email (or lack thereof).
Improve your click-to-open rate through:
- Email templates – Use an email platform that offers a wide selection of predesigned, mobile-optimized templates. These templates make creating and sending emails extremely convenient. They also ensure that your email renders perfectly on any device, whether it’s desktop or mobile.
- Segmentation – Send relevant emails to your subscribers by leveraging their behavioral data, such as transaction history, type of emails opened, and offers clicked on.
- Automation – Automate your targeted emails so that subscribers receive them at the right time.
Police your email unsubscribe rate
When a subscriber opts out of receiving emails from you, that means they are no longer interested in your brand. That’s why monitoring unsubscribes is crucial to your email marketing strategy – it indicates the level of consumer interest.
Avoiding high unsubscribe rates is all about maintaining proper list hygiene.
If you’re not using the double opt-in method to confirm subscribers before they’re added to your list, start doing so immediately. Double opt-ins help you weed out invalid emails to keep your list clean and healthy.
With these up-to-date email marketing benchmarks, you’ll see how well your email marketing is doing, compared with other brands inside and outside your industry.
When you measure your own email data against industry benchmarks, you can set ideal baselines for metrics and choose which key performance indicators (KPIs) to focus on.

“What are typical conversion rates of content marketing realistically?” is one of marketers’ Top 100 Questions about content marketing. Here are the answers.


