To Make Buying Frictionless, Apply Big Data to Content Marketing

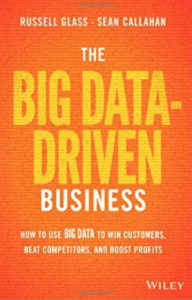
The Big Data-Driven Business, a book by Russell Glass & Sean Callahan, offers many useful insights for successful content marketing.
Big companies are using big data to improve marketing. As W. Edwards Deming once said, “In God we trust. All others must bring data.”
The book The Big Data-Driven Business shows how any size firm can gain valuable insights from data, even starting small.
You need 3 types of marketer on your team to succeed, notes Nick Panayi, director of global brand and digital marketing at CSC:

1.) Content jockeys who create content as writers, designers, illustrators, photographers and editors.
2.) Infrastructure jockeys who build and maintain the infrastructure for websites, marketing automation, email, analytics and more.
3.) Demand generation jockeys who use content and infrastructure to track buyers, and work to turn prospects into paying customers.
What I like most about this book is that it makes the ideas behind big data accessible to all 3 types of marketers. The book strips away the many layers of illusion about big data, such as the myth that big data is all about having the right tools.
In fact, big data is about having the right people. “A dashboard means little if there’s no one who can drive the car,” as Florian Zettlemeyer of Northwestern University’s Kellogg School of Business observes.

“No matter how much you measure, it takes people to determine the best use of data and to find the truth … The term may be big data, but in the end it’s the little triggers – little triggers identified by human beings – that will help business make the most of the information that’s out there,” the authors say.
With the right people, you can use big or small data to sharpen up your content marketing. Using your data to see how customers behave leads to better and better content over time. Big data leads to higher rates of conversion, and to sales and revenue that are linked to your content marketing program.
As the authors observe, your marketing needs to build up its data muscles over time. The more you use them, the stronger they get.
One case history in the book highlights our marketing team at Tellabs. The story began when I simply didn’t believe that Tellabs was getting its money’s worth from the website.
We decided to revamped Tellabs’ website. But along the way I became completely obsessed with one key question:
When a prospect comes to your website, what do you want them to do? And then what? And then what?”
That’s really a tough question. And too often, it’s overlooked when marketers create or rebuild websites.
We knew the answer was not: we need to update our website. We knew that we wanted customers to spend more time on the website. But we knew that wasn’t the whole answer either.
After a few weeks, I was able to crystallize the right question,
How do we make the customer’s path to conversion easy?”
As I told the authors, “We rewrote [the website] from scratch, and we had in mind that what we wanted to do was to get customers to go along the path with us, starting with a soft conversion.”
Our plan was to convert readers into customers, in 2 steps:
1.) First, we wanted a “soft” conversion – getting readers to read our blog, watch a video, read an article from our magazine or read a white paper.
2.) Then, we wanted a “hard” conversion – getting readers to register for a white paper and entering them into the demand generation system.
Job one was to get more “soft conversions.” In 2010 our revamped Tellabs website achieved a 10% soft conversion rate. At the time that seemed pretty good, but we had no idea how far we would be able to go with the help of big data.
As we applied big data from IBM Net Analytics and analyzed it in monthly meetings, our soft conversions year after year – reaching 46% in 2014.
How did we achieve a fourfold increase in soft conversions? We looked at all the data about our content marketing during a regular meeting every month.
We built up hypotheses about why customers behaved as they did, and we used the data to test our hypotheses.
“The IBM analytics helped Tellabs determine which content was performing best. At regular meetings, members of the marketing staff would discuss what the analytics indicated. ‘It’s like, ‘This is working; let’s do more of it,’ Stenitzer said. ‘This isn’t working, let’s get rid of it.’ And that’s what the data tells you.”
Over time, Tellabs marketing built a “content ladder” that prospects could work their way up, one piece of content at a time. We asked them to start with short content and work their way up to longer and longer content.
To get a prospect onto the first rung of our content ladder, we had to capture his attention for 7 seconds. That sounds simple. But it’s easier said than done.
That’s because Americans are bombarded by as many as 5,000 marketing messages per day. And the average American’s attention span is 8 seconds.
As I told the authors, “If we can get you with that 7 seconds of attention, the idea is I want to ladder you up to 2 minutes.”
We created this mental model for prospects who use our website and content marketing:
• First, we wanted to capture just 7 seconds of a prospect’s attention – through a headline, email subject line or a Tweet.
• Next, we wanted to ladder up the prospect to 2 minutes of content, such as a 400-word blog or a 2-minute video.
• Then, we wanted the prospect to read a 5-minute, 1,000-word article from our customer magazine Insight, or watch a 5-minute video.
• Finally, we wanted the prospect to dive deep into a 20-minute, 4,000-word white paper. New white papers required registration, but older ones did not.
As we progressed over time, big data taught us unexpected lessons, as Glass and Callahan wrote:
“One pathway to enticing readers into deeper engagement was to list links to related content on the right-hand side of Tellabs.com web pages. But the data showed that prospects were not clicking on a text link to ‘PDF Resources.’ To make these PDFs more noticeable, Stenitzer placed a red button on the right-hand side that read ‘PDF Resources’.
“’Until that big red button got planted in the right column, nobody even noticed the PDF link,’ Stenitzer said. ‘One of the first things we saw with our Net Analytics from IBM was that nobody went there. We had all this great content that people were missing, and the red button helped change that.’”
Another surprise: “The analytics demonstrated the value of white papers which require at least a 20-minute commitment to read from start to finish. ‘If I take my top 5 white papers, I actually get more hits on them than on the top 5 videos or top 5 blogs or the top 5 Insight articles,’ Stenitzer said. ‘So, even though the white papers are long-form content, when you get a serious buyer who’s going down the path toward a purchase, that white paper is really important, and they pay a lot of attention to it. While I put emphasis on the 7 seconds, 2 minutes, 5 minutes and then 20 minutes, one of the surprises that we got from the analytics is 20 minutes is where they really want to go’…
“Tellabs also discovered other details from using data to tie together content, leads, and revenue. ‘We learned that almost all of our marketing-sourced sales came from North America and Europe … We learned that marketing was much more successful in selling our optical product than in selling our mobile product.’”
Without big data and our monthly analytics meetings, we never could have achieved the results my team did at Tellabs.
Over time, we increased soft conversions and, more importantly, hard conversions.
Our CEO had set a goal for marketing to produce $1 million in revenue the first year; we achieved $2 million. The year after that, we made $3 million. Because many of the sales were to non-typical customers, the sales cycle was shorter and the profit margins were higher.
While those were good results, I believe they shed light on only about half of marketing’s success. Our measures remained incomplete because:
• Unfortunately, we did not have a CRM system or an enforced requirement for salespeople to report back to marketing on leads.
• So sales provided feedback to marketing on only 50% of the marketing qualified leads we sent to them.
• Our sales cycle for typical telecom network customers was 18 to 24 months, so we had not had enough time to complete the sales cycle on many content marketing-generated leads.
After the company was acquired, I left Tellabs. These days I’m working with clients to take a data-driven approach for companies of all sizes – whether a one-person consultancy, a start-up, a small business or a big corporation.
To learn more about how to apply data in your business, I highly recommend the book The Big Data-Driven Business. Here are some of the key takeaways from the book.
11 Steps to Applying Big Data to Content Marketing
Here’s a set of 11 principles to follow as you bring big data into your business:
1.) Focus on the customer to determine what questions you can your data to answer.
2.) It’s big data, but start small.
3.) Don’t bet everything on technology.
4.) Hire the right people.
5.) Maintain some control of the technology piece.
6.) Measure, measure and measure some more.
7.) Stay on top of your data and the processes around it.
8.) Conduct a data audit and strive to integrate data silos.
9.) Cooperate with IT, sales, human resources and other stakeholders.
10.) Practice good data hygiene.
11.) Develop a road map, but anticipate detours.
Are you applying data to improve results from your content marketing? What surprises are you finding?
Contact Us


